How to Backtest a Trading Strategy Step by Step
Backtesting a trading strategy means defining clear entry and exit rules, then testing them against historical price data to see how they would have actually performed.
Browse all blog articles
How to Backtest a Trading Strategy Step by Step
Backtesting means applying a fixed set of trading rules to past prices to see how they would have performed. It’s the cheapest way to reject a bad idea. It’s also easy to fool yourself with one. This guide walks through a real test we ran, including the disappointing results, because they’re the most useful part.
Step 1: Write rules with no judgement in them
If two people could read your rule and take different trades, it’s not ready to test. “Buy when momentum looks strong” can’t be tested. Here’s the rule we used, and every part of it can be checked by a computer.
- Market: Bitcoin and the S&P 500 ETF SPY, on daily candles.
- Enter long at the close when the 20-day simple moving average crosses above the 50-day.
- Exit at the close when the 20-day crosses back below the 50-day.
- Stop-loss: two average true ranges (ATR 14) below the entry, checked against each day’s low. If the day opened below the stop, the exit uses that lower open.
- Fees: 0.05% on the way in and on the way out.
Step 2: Split the data before you look at results
We kept the most recent third of the data aside and ran the rule on the earlier part first. That later part acts as a test the rule has never seen. Without this split it’s easy to keep adjusting settings until the past looks good, which tells you nothing about the future.
Step 3: Read the results honestly
| Test | Trades | Wins | Rule return | Rule worst drop | Buy and hold | Hold worst drop |
|---|---|---|---|---|---|---|
| BTC, Nov 2022 to Jul 2025 | 11 | 3 | +7.0% | -36.1% | +607.9% | -28.1% |
| BTC, Jul 2025 to Nov 2026 | 5 | 2 | +6.4% | -28.0% | -33.6% | -53.0% |
| SPY, Feb 2021 to Dec 2024 | 8 | 1 | -9.0% | -18.4% | +54.6% | -25.4% |
| SPY, Dec 2024 to Oct 2026 | 2 | 1 | +13.9% | -5.7% | +25.2% | -19.0% |
What does this show? First, the rule lost badly to buy and hold in three of the four tests. Second, it did protect against the big Bitcoin decline in the later period, making a small gain while holding lost a third. Third, it wins rarely: 7 of 26 trades across all tests. Fourth, the SPY test’s later period has just two trades, so that result means almost nothing.
An honest verdict is that this isn’t a strategy to trade as it stands. It might be useful as a trend filter, but that’s a new idea which needs its own test. Most backtests should end this way, and that’s not a failure. You’ve learned something without losing any money.
Step 4: Look past the return figure
- Number of trades: under 30 is weak evidence. Most of our tests fall below that, so we can’t draw firm conclusions.
- Worst drop: could you really sit through -36%? That figure is often more important than the return.
- Average win and loss: the Bitcoin rule’s average winner in the first period was +18.0% and its average loser was -5.0%. This is why a 27% win rate could still make money.
- A benchmark: always compare with simply holding the same asset over the same period.
- Time in the market: a rule that’s rarely invested isn’t directly comparable with one that always is.
Step 5: Stress-test the costs
We reran the full period at a 0.20% fee each way, four times higher, to see how fragile the result is. Bitcoin’s return over the whole period came to +9.3%, while SPY’s came to +5.5%. Slower rules like this one are not very sensitive to costs because they trade rarely. A rule that trades many times a day is a very different story, and realistic costs often wipe it out completely.
Common ways backtests lie
- Overfitting: testing hundreds of setting combinations and keeping the best. It’ll almost always look good on that data, purely by chance.
- Lookahead bias: using information you wouldn’t have had at the time, such as entering at a close you could only know after it happened.
- Survivorship bias: testing only stocks that exist today ignores the ones that failed. We tested NVIDIA-style winners elsewhere in this blog, and those results flatter any rule.
- One market type: a test that covers only a bull market tells you little about a bear market.
- Ignoring gaps and slippage: real stops can fill much worse than the level you set.
Step 6: Then test it by hand, then live
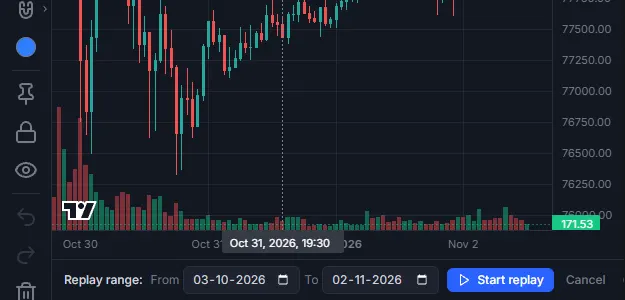
A rule that survives should go through chart replay next, so you can feel how it behaves when the next candle is unknown. After that, paper trade it live. If you can’t follow it in replay, the backtest result won’t matter.
These figures came from our own calculations on daily candles from the data feed the simulator uses, through November 2, 2026 for Bitcoin and October 30, 2026 for SPY. They’re historical and educational, aren’t a recommendation, and don’t predict future results.
Want to apply the ideas immediately? Try our free paper trading tool and practice with $20,000 in virtual cash.