How to Use Market Replay to Practice Trading
Market replay rewinds the chart to any past date and lets you step forward candle by candle, so you can practice reading and reacting to real historical price action.
Browse all blog articles
How to Use Market Replay to Practice Trading
Market replay shows a past stretch of the chart one candle at a time, with everything after your current point hidden. You see only what a trader saw at that moment. It’s one of the fastest ways to get experience, because you can practise months of decisions in an afternoon. This guide shows how it works in The Tradeskill and how to avoid the habits that make it useless.
Why not just read old charts?
A finished chart is misleading because you already know what happened. Every breakout looks obvious once you can see where it went. Replay removes that hindsight. When the next candle is hidden, you have to decide with incomplete information, which is what trading actually is.
How to start a replay
- Open the chart and choose your market and timeframe. We used BTC-USD on the 1-hour chart.
- Click Replay in the bar below the chart.
- Choose a From and To date, then click Start replay.
- Use step forward to reveal one candle at a time, or play with a speed setting. Step back rewinds. Jump to date moves to a specific day.
- Click Exit to return to the live chart.
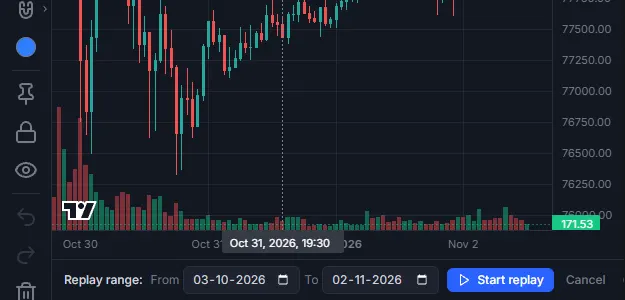
A worked example: October 29, 2026
Here’s the exercise we ran. We started a replay on the Bitcoin 1-hour chart from October 27 and stepped forward until the afternoon of October 29. On that day, reports emerged that about $6.3 billion had been stolen from Binance’s hot wallets, but in replay you can’t see that coming.
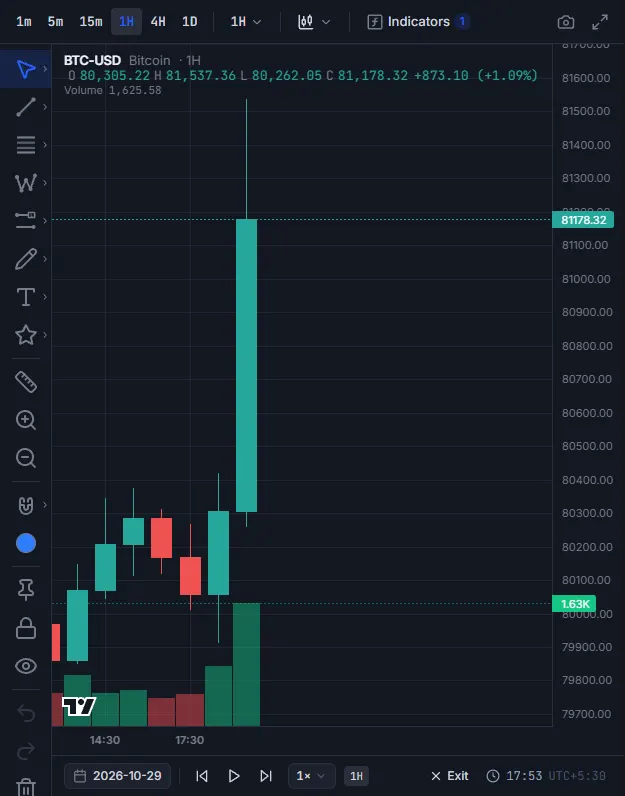
At this point the chart looks strong. The last hourly candle was up 1.09%, closing at $81,178 with rising volume. This is exactly the moment to stop and write down what you’d do. Would you buy? Where would your stop be? How much would you risk?
Only then step forward. Bitcoin’s daily high that day was $81,971, and it closed at $77,992. The next day it fell as low as $76,326.
| Date | Open | High | Low | Close |
|---|---|---|---|---|
| Oct 28, 2026 | $80,910 | $81,823 | $80,397 | $81,344 |
| Oct 29, 2026 | $81,344 | $81,971 | $77,910 | $77,992 |
| Oct 30, 2026 | $77,992 | $78,804 | $76,326 | $77,369 |
Suppose you bought at $81,178 with a stop 2% lower, near $79,554, and risked $200. You’d have lost your $200, which is annoying but planned. Without a stop, you could have been down about 6% by the next day. The value of the exercise isn’t predicting the news. It’s seeing what your risk plan does when the news arrives.
Rules that keep replay honest
- Choose your dates before you look at them. If you pick a stretch you remember, you’ll trade your memory.
- Hide the future. Don’t zoom out or scroll ahead, and exit if you accidentally see what’s coming and pick another period.
- Write the decision before stepping forward. It only needs to be a line: entry, stop, target, or “no trade”.
- Include boring stretches. Most real trading is waiting, so practise not trading too.
- Don’t rewind to fix a bad decision. Step back is useful for studying a move afterwards, but not for redoing the trade.
What to practise
Replay is best with a specific goal. Pick one of these for each session rather than trying everything at once.
- A single setup: find 20 examples and record how many worked and why others didn’t.
- Stop placement: for each entry, note where a sensible stop goes and how often normal noise would have hit it.
- Patience: go through a whole week and take only your best one or two trades.
- Fast markets: replay days with big moves, like the ones above, to see how your plan holds up.
A simple scorecard
After a session, write down how many candles you stepped through, how many trades you took, how many followed your rules and what the result was in risk units. A win of $400 on $200 of risk counts as +2, and a stopped-out trade counts as -1. Using risk units makes sessions comparable, even if your position sizes changed.
Compare sessions over time. Taking fewer trades with better rule-following is real progress, whatever the dollar result happens to be. Keep the sessions short, too, as decisions get worse when you’re tired.
What replay doesn’t do
Replay trains judgement, but it doesn’t provide proper statistics, and small samples can mislead you. Because you control the pace, it also removes the pressure of a live candle closing while you decide. Your memory of the market can leak in too, especially on famous dates. It’s best used together with a written journal, then followed by live paper trading.
This article is educational. The dates and prices are real, and the buy example is hypothetical, not a recommendation.
Want to apply the ideas immediately? Try our free paper trading tool and practice with $20,000 in virtual cash.